
Facebook Ads Dashboard: 7 Metrics you should Watch Weekly 2025
Are you tired of wasting ad spend on Facebook campaigns that don’t deliver results? If yes, you are not alone. Many digital advertisers find themselves stuck in a cycle of low return on investment (ROI) and inefficient ad targeting. One of the secrets to turning this around is to “Track these 7 essential metrics in your Facebook Ads dashboard for better ad performance.”
Understanding and regularly monitoring key Facebook Ads dashboard metrics can make the difference between a failing campaign and a successful one. Through this post, we will unveil the essential Facebook Ads metrics that you need to monitor weekly to ensure your campaigns are optimized for success.
Table of Contents
The Importance of Monitoring Facebook Ads
Your Facebook Ads dashboard serves as a real-time window into the performance of your ad campaigns. By keeping a close eye on this dashboard, you can make informed decisions that directly impact your ad spend efficiency and overall marketing ROI. According to a study, businesses that actively monitor their ad performance are 20% more likely to achieve a positive ROI from their digital advertising efforts.
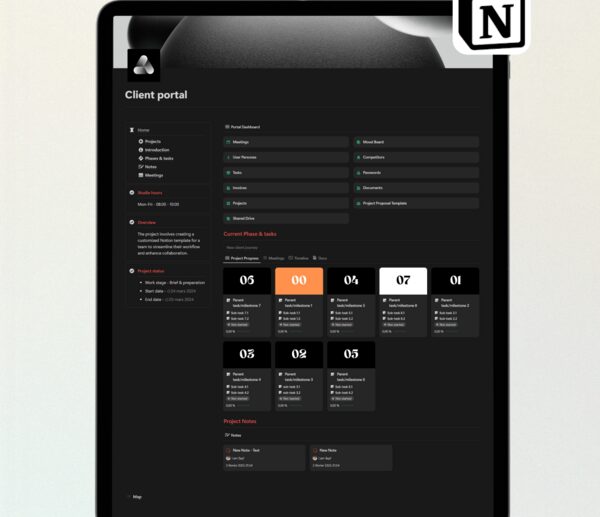
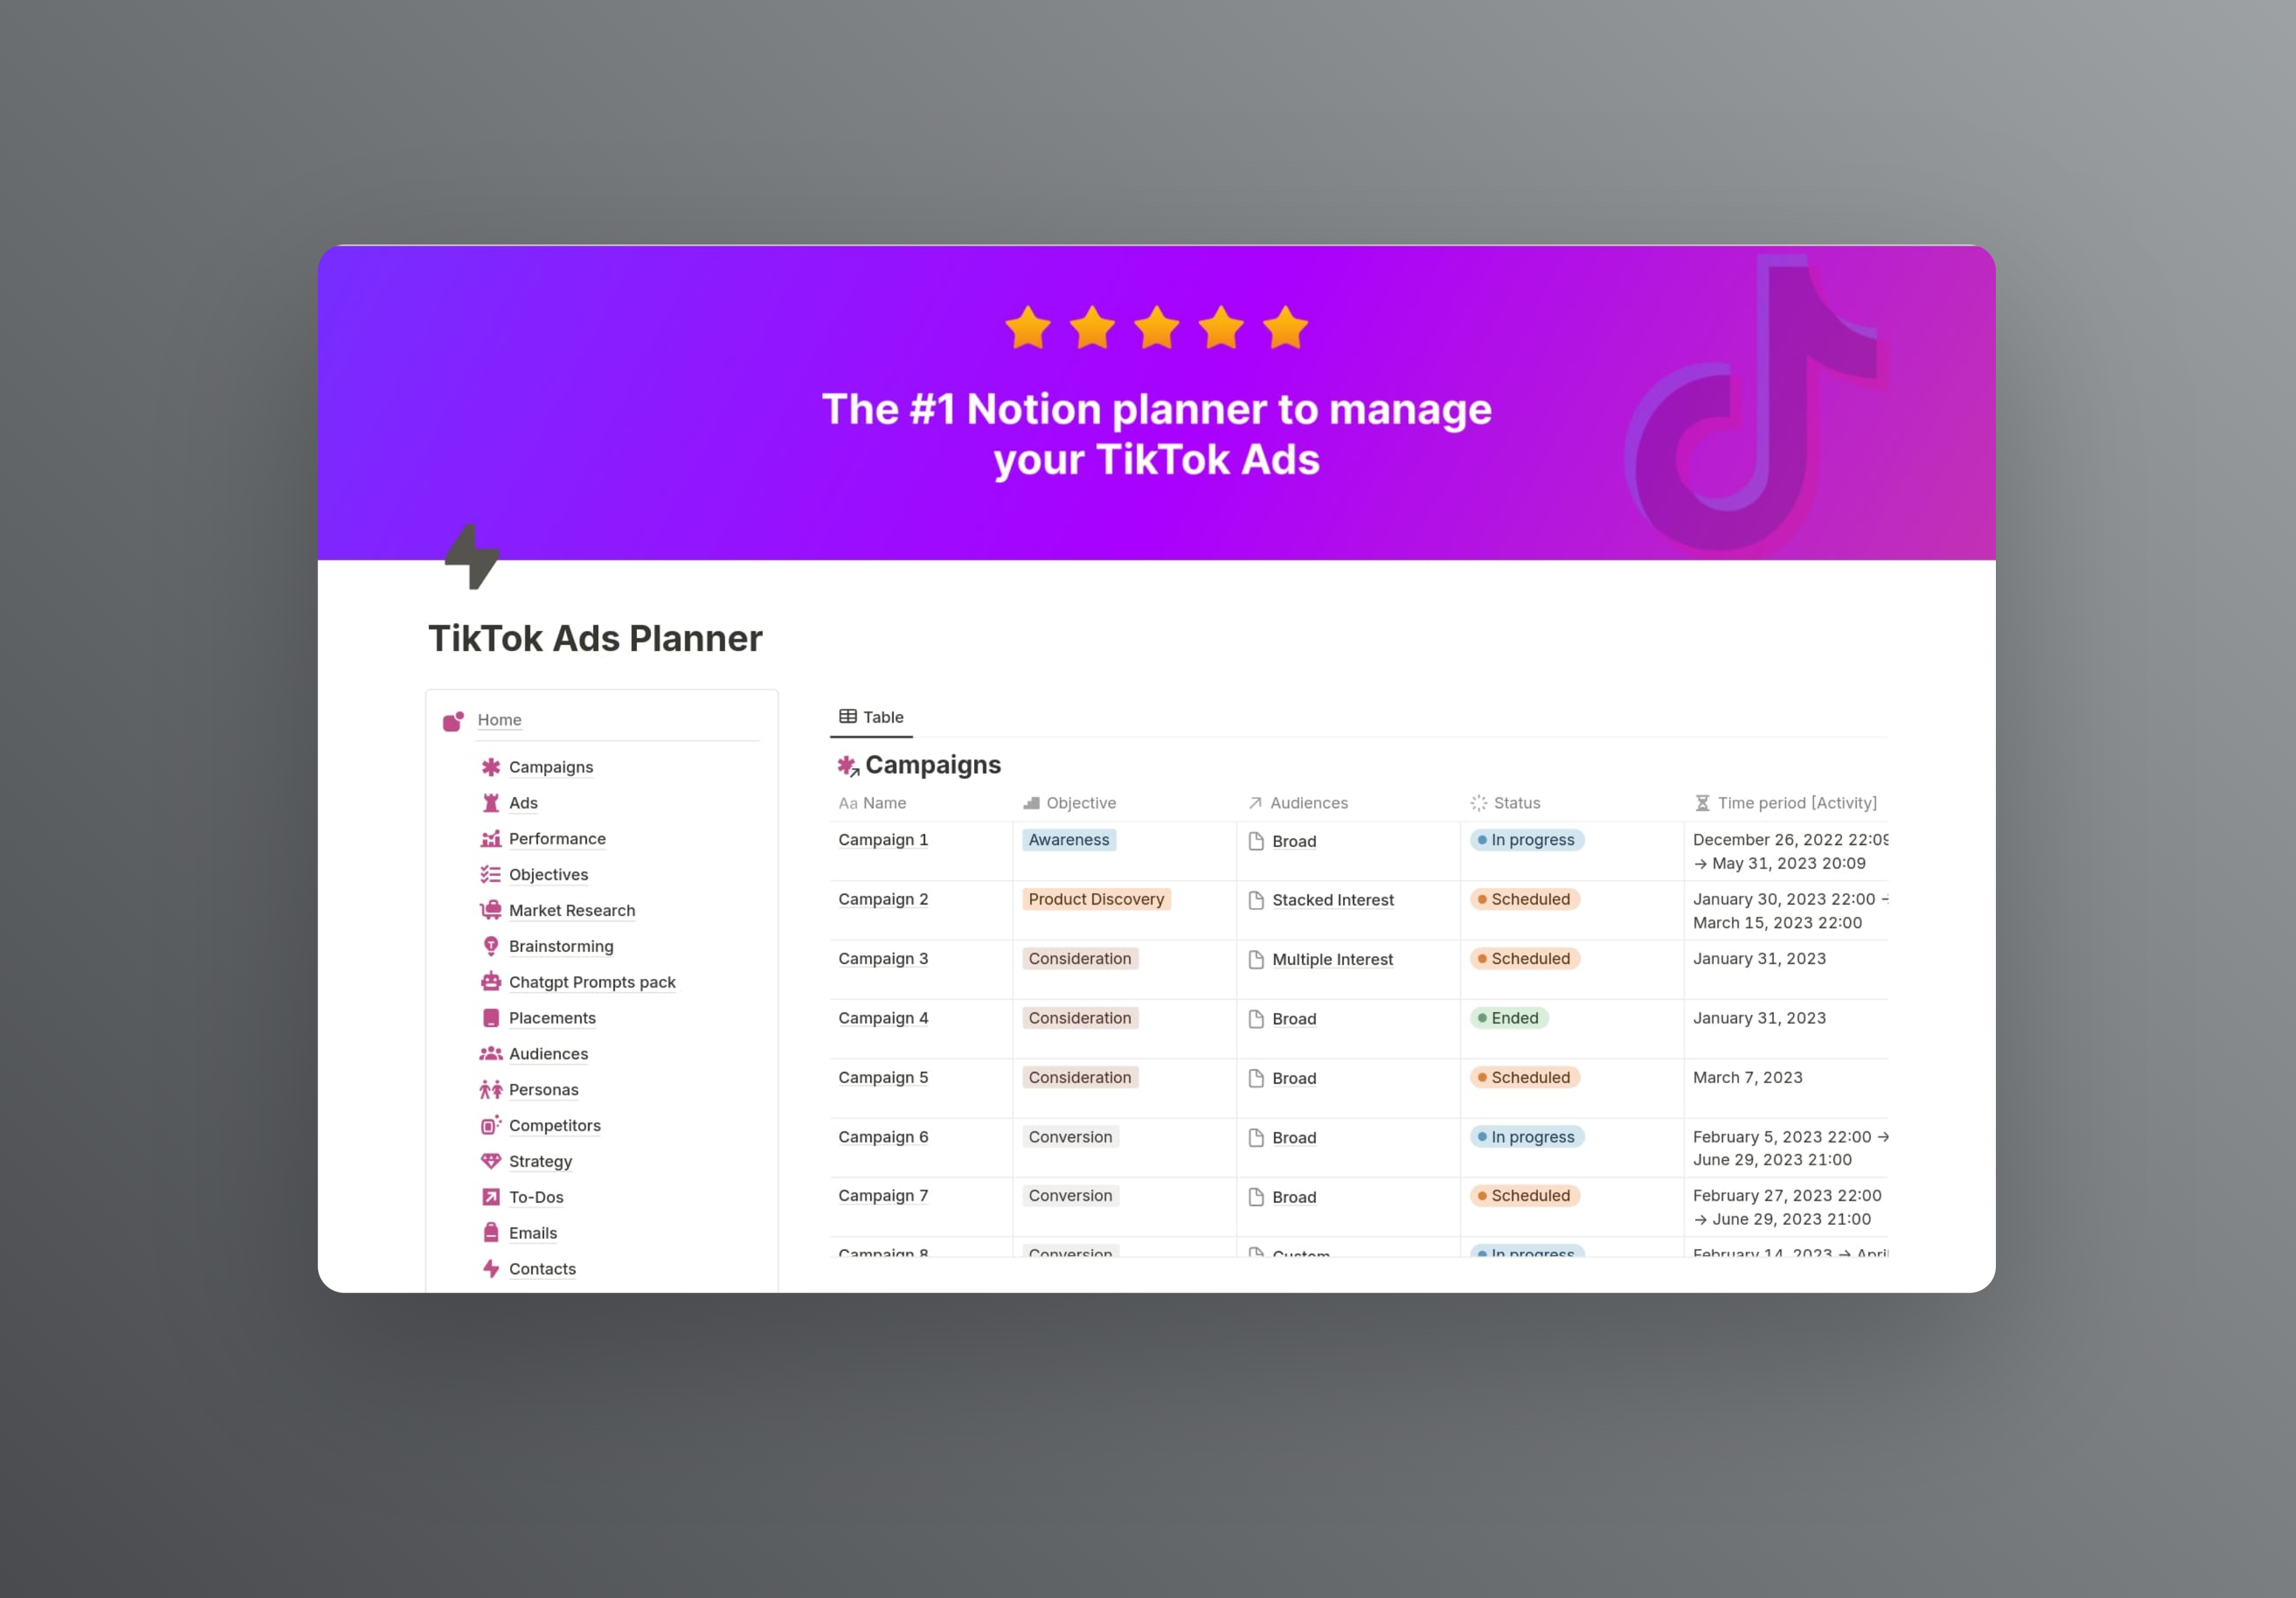
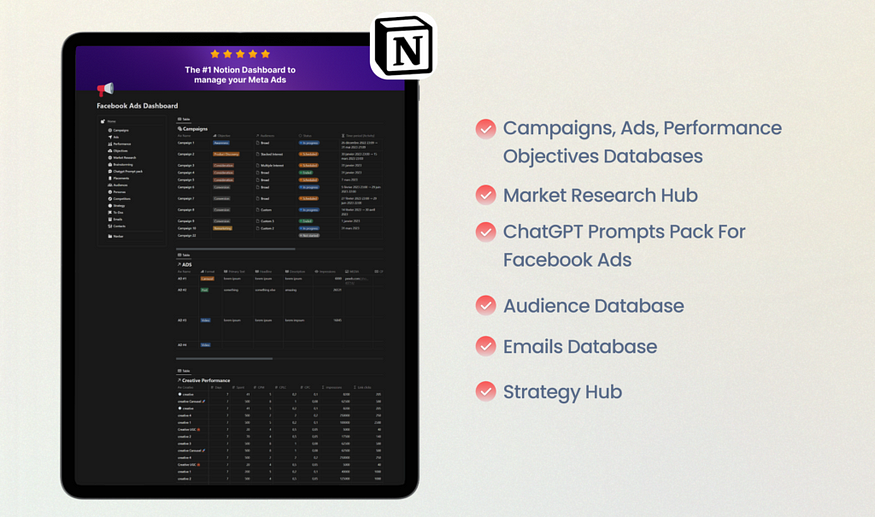
Download Notion Facebook Ads Planner
Key Metrics to Monitor Weekly
Click-Through Rate (CTR)
What Is CTR? CTR, or Click-Through Rate, is calculated by dividing the total number of clicks by the number of impressions (clicks divided by impressions). It measures how often people who view your ad end up clicking on it.
Why It Matters: A high CTR indicates that your ad is resonating well with your target audience. It is a strong signal that your ad copy and creative are compelling enough to drive action. The average CTR for a Facebook ad is about 0.9%, but an effective campaign should aim for a CTR of around 2-3%, depending on the industry.
Cost Per Click (CPC)
What Is CPC? CPC, or Cost Per Click, is defined as the total ad spend divided by the total clicks received (total spend divided by clicks).
Why It Matters: It is a crucial metric for budget management. A lower CPC means that you can drive more clicks for less money, thus stretching your ad budget further. However, a lower CPC should not be pursued at the expense of ad quality and relevance. The average CPC on Facebook ranges from $0.50 to $2.00 depending on the industry.
Conversion Rate
What Is Conversion Rate? The conversion rate is the percentage of clicks that result in a desired action like a purchase, sign-up, or other defined goals.
Why It Matters: A high conversion rate indicates that your ad is not only attracting clicks but also effectively convincing users to take the action you want. The average conversion rate across all industries is approximately 9-10%, but specific goals and industries may have different standards.
Return on Ad Spend (ROAS)
What Is ROAS? ROAS, or Return on Ad Spend, is calculated by dividing the revenue generated from the ad campaign by the total ad spend (revenue generated divided by ad spend).
Why It Matters: ROAS is crucial for determining the profitability of your ad campaigns. A ROAS of 4:1 means that for every dollar spent on ads, you make $4 in revenue. While a 4:1 ROAS is often seen as a good benchmark, the “desirable” ROAS can vary based on your profit margins and business model.
Cost Per Result (CPR)
What Is CPR? Cost Per Result depends on your campaign objective such as cost per lead, cost per like, cost per download, etc. It is defined as the total ad spend divided by the total number of results (desired actions).
Why It Matters: CPR directly measures ad spend efficiency. For instance, if your campaign goal is lead generation, a lower cost per lead is preferred because it means you are getting leads at a lower cost.
Frequency
What Is Frequency? Frequency is defined as the average number of times a user sees your ad.
Why It Matters: High frequency can lead to ad fatigue where your audience becomes tired of seeing your ads, which can result in a lower CTR and higher CPC. An ideal frequency should be kept below 3.5 to avoid ad fatigue while still ensuring that your ad is seen enough times to make an impact.
Return on Investment (ROI)
What Is ROI? ROI, or Return on Investment, is defined as the profit generated from an ad campaign divided by the ad spend (profit generated divided by ad spend).
Why It Matters: While ROAS focuses on revenue, ROI considers the actual profit after costs such as product, delivery, and other expenses are deducted. This makes ROI a more comprehensive measure of your ad campaign’s value to your business.
How to Set Up a Facebook Ads Dashboard

To make sure you are closely tracking these metrics, you need a well-organized Facebook Ads dashboard. Here’s a step-by-step guide on how to make one:
- Log in to Facebook Ads Manager.
- Navigate to the “Customize Columns” option where you can select the metrics you want to include in your main dashboard. Ensure that the 7 key metrics listed above (CTR, CPC, Conversion Rate, ROAS, CPR, Frequency, and ROI) are selected.
- Create a custom report and name it “Weekly Metrics Review” for easy access.
- Use the schedule report feature to automatically email yourself these metrics weekly.
Download Notion Facebook Ads Planner
Best Practices for Weekly Metric Review
Regular weekly reviews are key to ad campaign success. Here are best practices for making the most out of your review:
- Set a regular time each week to review your ad performance.
- Compare the current week’s performance to previous weeks to identify trends.
- Based on your observations, make data-driven decisions such as pausing underperforming ads or reallocating budget to the top performers.
- Test new creatives or ad copies if CTR or conversion rates are lower than desired.
Common Mistakes to Avoid
- Focusing on Vanity Metrics: Avoid focusing on metrics that might not directly contribute to your campaign goals, such as likes and shares unless they are your specific goals.
- Ignoring Ad Fatigue: If your frequency is too high, it could lead to ad fatigue which negatively impacts performance metrics like CTR and CPC.
- Lack of A/B Testing: Not conducting A/B tests on ad creatives and copies can make it difficult to understand what drives better results.
Maintaining and Optimizing Your Ad Campaigns
- Monitor and Optimize in Real Time: Don’t wait until the end of the month to make changes. Revisit your ads frequently and make adjustments based on their performance data.
- Utilize Automated Rules: Facebook Ads Manager allows you to set up rules such as automatically pausing ads with a high CPR or a low CTR.
- Regular Refreshes: Keep your ad creatives and copies fresh to avoid ad fatigue. Test new images and copywriting frequently.
Conclusion
By tracking the 7 essential metrics—CTR, CPC, Conversion Rate, ROAS, CPR, Frequency, and ROI—you can make informed decisions that enhance the performance of your Facebook ad campaigns. Remember that regular weekly reviews are the key to staying on top of your ad performance and making necessary adjustments for better results.
Call to Action: Want a more hands-off approach? Download our [free Facebook Ads reporting template] to make weekly metric reviews a breeze.
FAQs
How often should I update my ad campaigns based on these metrics?
It is recommended to review your ad campaigns weekly. However, for high-spending campaigns, you might want to check daily.
What is the most important metric for a new ad campaign?
Initially, focus on CTR and CPC because they indicate how well your ad is received. Once you establish a good CTR, the focus should shift to Conversion Rate and ROAS.
How can I lower my CPC effectively?
By improving ad relevance which can be achieved by refining your target audience, enhancing ad creatives, and optimizing ad copy based on A/B testing results.
What should I do if my CTR is high but my conversion rate is low?
This might indicate that while your ad copy is engaging, your landing page might not be effective. Focus on optimizing your landing page for a more seamless user experience and clear call-to-actions.
Is there a standard good ROAS value I should aim for?
A ROAS of 4:1 (meaning $4 in revenue for every $1 spent) is generally considered a good benchmark. However, it’s important to set a ROAS goal based on your specific profit margins and business goals.
Download Notion Facebook Ads Planner
Read also : 6 Game-Changing Marketing Notion Templates to Skyrocket Success in 2025